Where all geospatial files are displayed and analyzed. There are 2 main parts: layer control and toolbar.
Layers Control
Where controls and manages displayed layers like raster file or vector file.
Control Tools
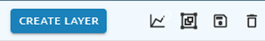
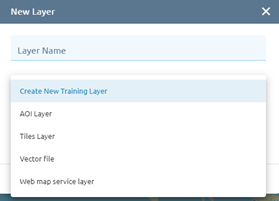
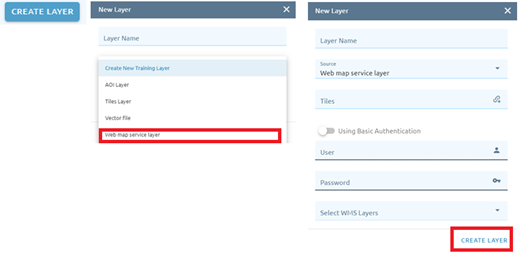
Create layer: user can create new layer by add new layer or upload from AOI layer, Tiles layer, Vector file or Web map service layer
Time serial: with images which have the data acquired, can be selected to show the chart of time series.
Add new group
Click icon to add new group the layers:
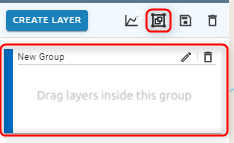
You can drag and drop the layer into the group.
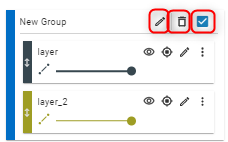
For each group:
Click icon to edit group name
Click icon to delete group
Click checkbox to view all layers in group
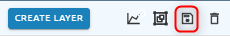
Save
Click icon to save workspace layer
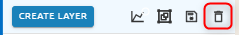
Delete
Click icon to delete all layers on Layers control
Display Image
Image will displayed in layer control:
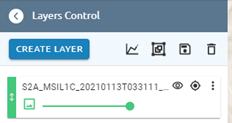
With icon to view or not view the image, the location icon to zoom to layer/ image and more option can be discovered by icon
The image added from Imagery will have 5 options: Rename, Properties, Tile Info, Spatial Adjustment
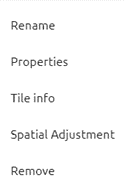
The raster is result of detection, some tools will have 4 options: Rename, Properties, Labels control, Remove.
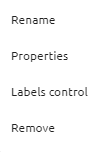
Rename
Allows user change the name of layer.
Properties
Symbology
Will help users to change the display of images manually by using band rendering, min/max value setting and color rendering
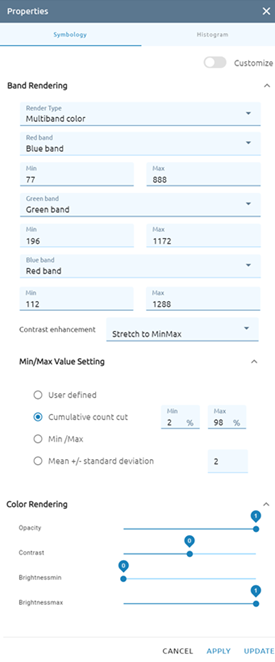
With customize function: users can use formulas to display images.
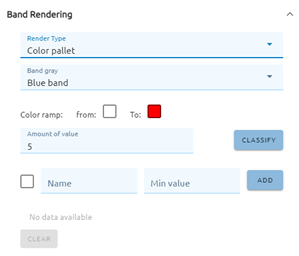
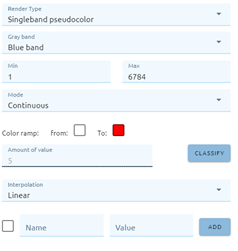
Band rendering: have 4 choices for users: Multiband color/ Color Pallet / Singleband gray/ Singleband pseudocolor.
Multiband color: allows users to have the composition of bands to display the image, three selected bands from the image will be used as the red, green or blue component of the color image. Allow to fetch Min and Max values for each band of the raster and scale the coloring accordingly.
Color pallet: This is the standard render option for singleband files that include a color table, where a certain color is assigned to each pixel value. (using button “classify” by doing automatically or add manually by using the button “Add”)
Singleband gray: This renderer allows you to render a single band layer with a color gradient: ‘Black to white’ or ‘White to black’
Singleband pseudocolor: This is a render option for single-band files that include a continuous palette. with 3 modes: continuous, equal interval and quantile and 3 types of interpolation color: Exact, Discrete, Linear. (using button “classify” by doing automatically or add manually by using the button “Add”)
A Contrast enhancement method can be applied to the values: ‘No enhancement’, ‘Stretch to MinMax’, ‘Stretch and clip to MinMax’ and ‘Clip to min max’.
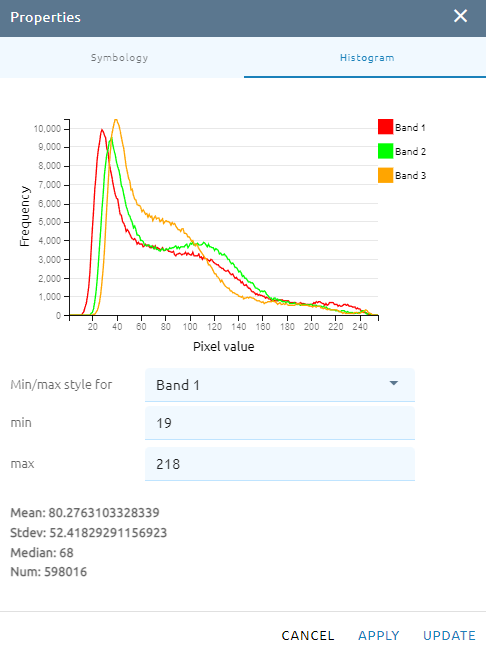
Histogram
Tile Info
The information of Tile image.
Spatial Adjustment
To adjust an image to another image.
Remove
Remove layer.
Labels control
To show the labels of results image.
Display Vector
Vector can be added from AOI folder, Tile layer, from PC, web map service layer or even create new layer.
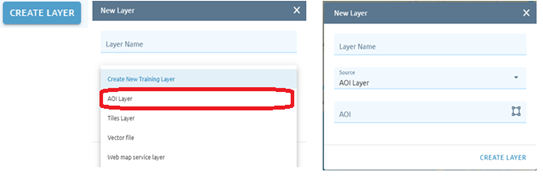
Vector added from the AOI layer by using the control tool “Create Layer” then select the AOI layer, next put the name and select the available AOI. Finally click on “Create layer”
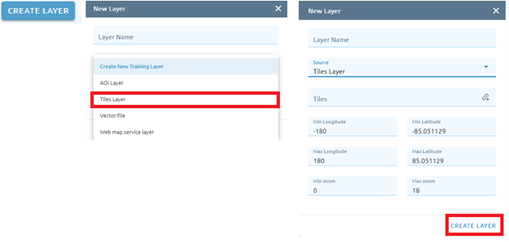
Vector added from the Tiles layer folder by using the control tool “Create Layer” then select the tile layer, next add the URL and finally click on “Create layer”.
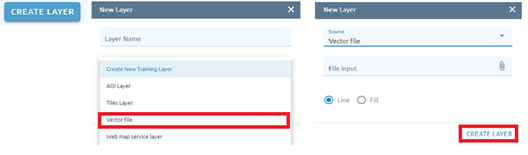
Vector added from PC by using the control tool “Create Layer” then select the vector layer, next click on File input and select the vector file from PC. Finally click on Create Layer.
Vector added from the web map service layer by using the control tool “Create Layer” then select the web map service layer, and fill the information there before clicking on Create Layer.
The vectors will have functions by click on icon. There are 7 functions: Rename, Style, Filter, Table properties, Feature count, Remove and Download.
Change the name of layer.
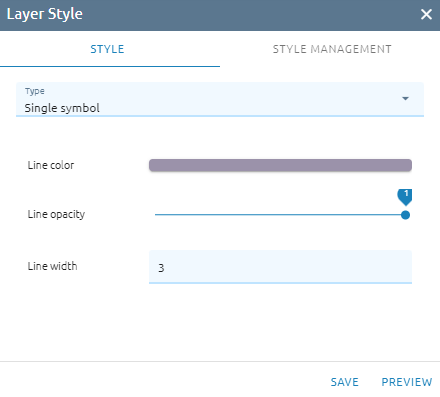
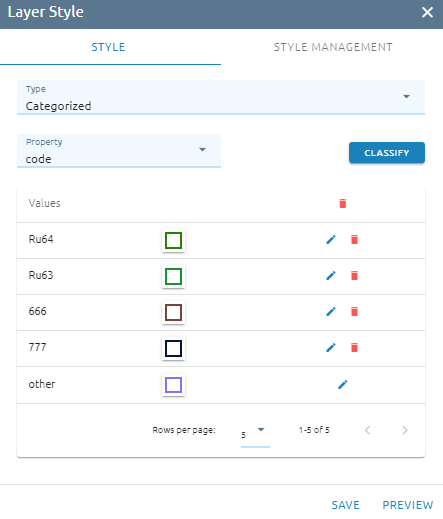
Change the style like color, opacity and width.
Single symbol
Allow users to style simple. Users can save new style (first), overwrite old style or preview on map.
Rule-based
Allow users to style by expression, can edit or delete expression.
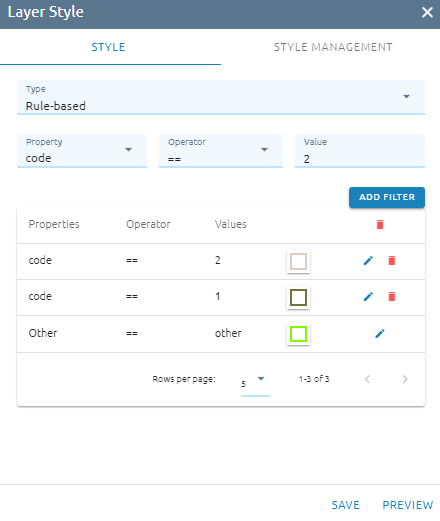
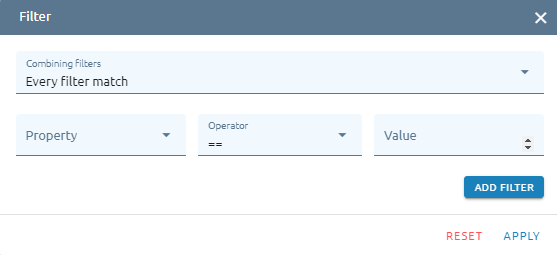
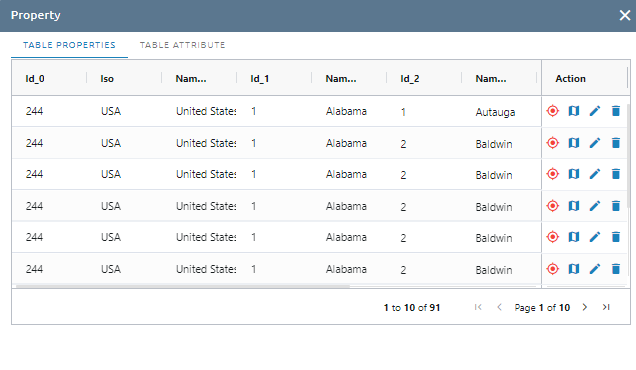
Table properties
Allow users to view the properties and attribute of vector layer. Also allow users to zoom to, highlight, edit and delete features. Table Attribute to know what type of each attribute of layer.
Click Table Attribute tab to view attributes of that vector:
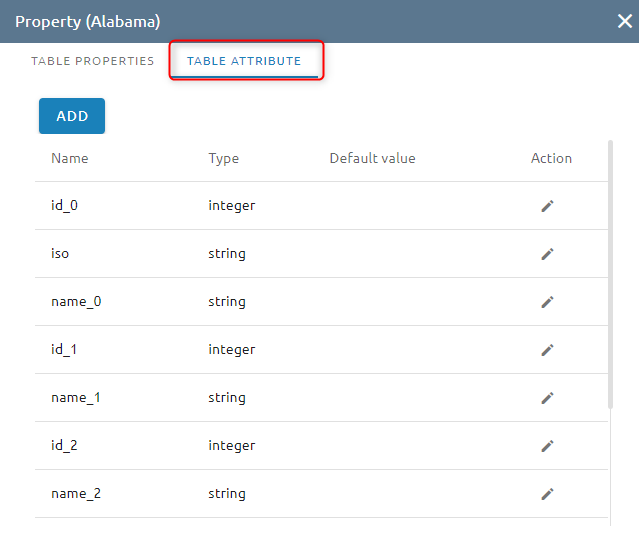
Click Add button to add attribute and click pen icon to edit attribute (column name, type). Beside, you can set default value for each column.
Feature count
Count the number of features in layer.
Remove
Remove layer from Control Layers.
Download
Download the layer to the computer with format geojson.