Tools
This is table toolkit
Tabulate Area
Calculates cross-tabulated areas between two datasets and outputs a table. Output table that will contain the summary of the area of each class in each zone. Each record will store the area of each class (in raster) within each zone (vector).
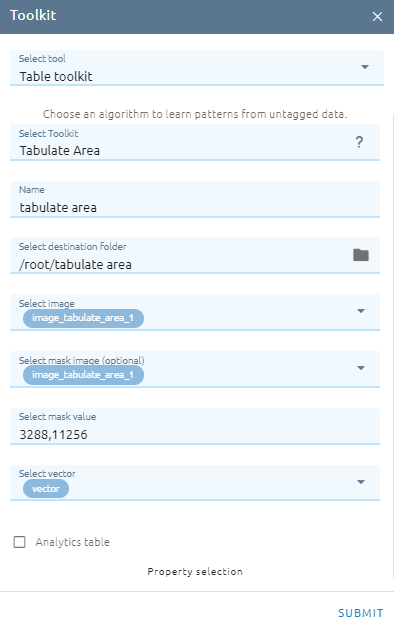
Type Name
Select destination folder to store result
Select image
Select mask image
Select mask value: fill some values of image. If select all value, skip this field.
Select vector
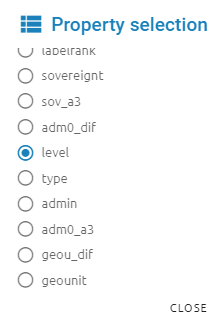
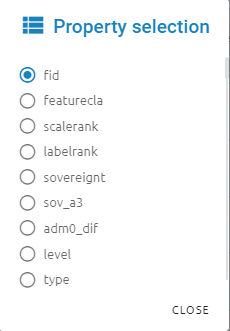
Property selection: Field that holds the values that define each zone.
Join
Join tool is used to combine data or rows from two or more tables based on a common field between them.
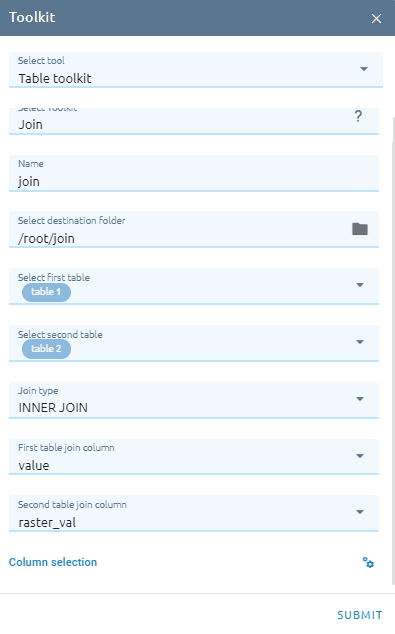
Inner Join: creates a new table by combining column values of two tables based upon the join-predicate. When the join-predicate is satisfied, column values for each matched pair of two rows are combined into a result row.
Left Join: returns all rows from the left table, even if there are no matches in the right table. This means that a left join returns all the values from the left table, plus matched values from the right table or NULL in case of no matching join predicate.
Rigth Join: returns all rows from the right table, even if there are no matches in the left table. This means that a right join returns all the values from the right table, plus matched values from the left table or NULL in case of no matching join predicate.
Full Join: combines the results of both left and right outer joins. The joined table will contain all records from both the tables and fill in NULLs for missing matches on either side.
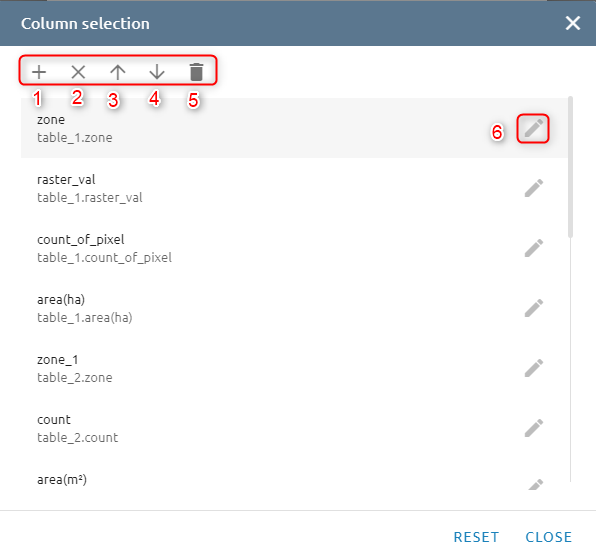
Column selection: add (1), delete selected item (2), change sequence field (3, 4), delete all item (5) and edit item (6).
Zonal Statistics as Table
Summarizes the values of a raster within the zones of another dataset and reports the results as a table.
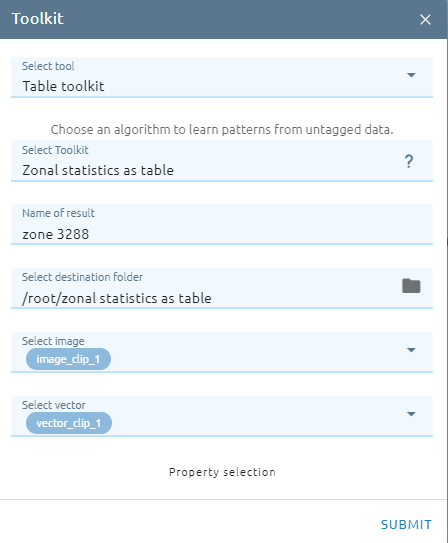
Type Name
Select destination folder to store result
Select image
Select vector
Property selection: The field that contains the values that define each zone.
Accuracy Report
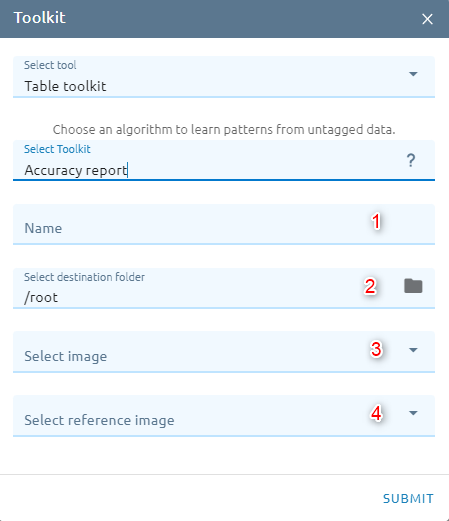
Type Name
Select destination folder to store result
Select image
Select reference image
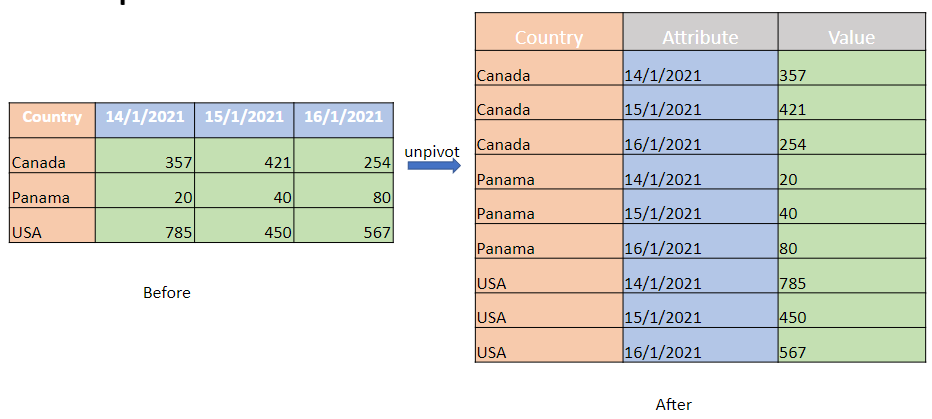
Unpivot Columns
Flattening the data, to put it in a matrix format so that all similar values are in one column.
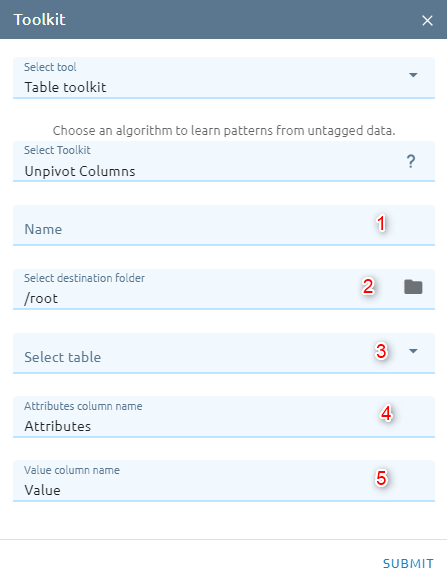
Type Name
Select destination folder to store result
Select table
Type Attributes column name: which are unpivoted into a new column and mapped to the new Values column.
Type Value column name
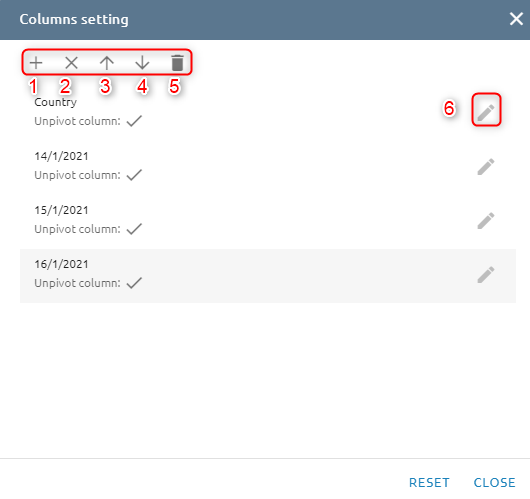
Columns Setting:
Column selection: add (1), delete selected item (2), change sequence field (3, 4), delete all item (5) and edit item (6) to switch on/off the unpivot.
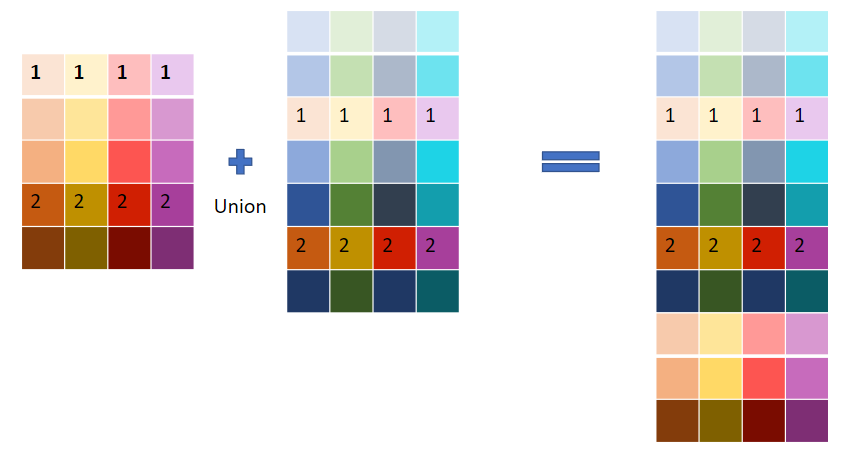
Union
Combines the results of two or more tables into a single table that includes all the rows that belong to all tables
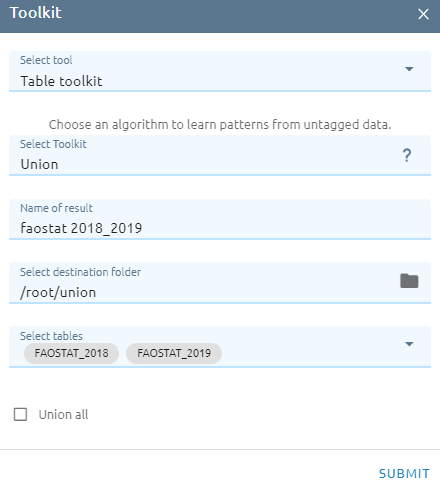
Type Name
Select destination folder to store result
Select tables: select two or more tables
Choose option Union all: when keeping all rows of each table.