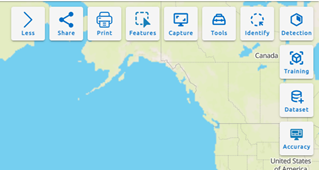
Toolbar
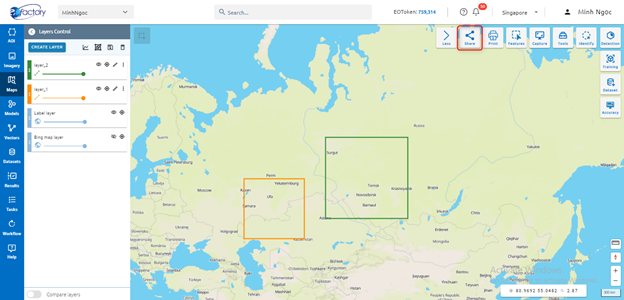
Share
Allow users to share maps for other users by link.
Step 1: Create map
Step 2: Click Share button
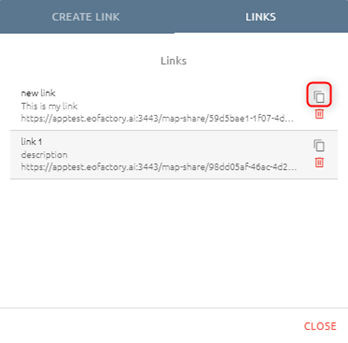
Step 3: Create link
Type link and description

Step 4: Click Submit button
After submitting a link, the link will be created at tab Links. Click tab Links to check.
Step 5: Copy link and send to other users
Click icon to copy link:
Print
Step 1: Click Print button:
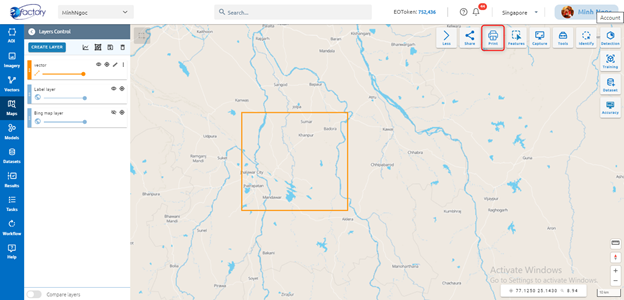
Step 2: Type input before print:
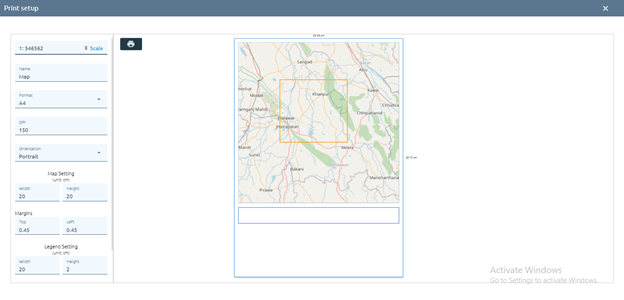
Step 3: Click print icon
Enter the parameters:
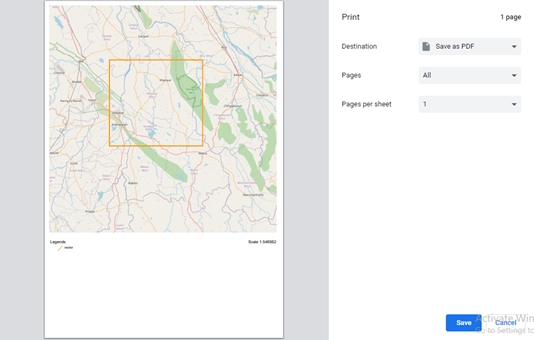
Step 4: Click Save button
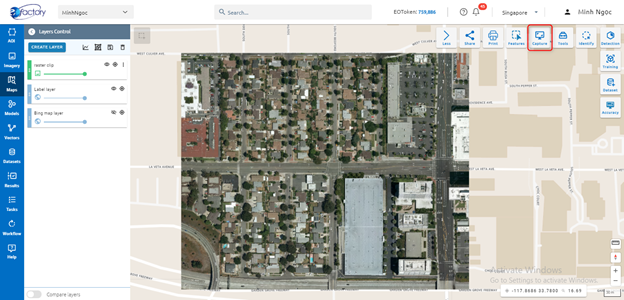
Tools
ARD Toolkit
Click the link ARD Toolkit to see details.
Vector Toolkit
Click the link Vector Toolkit to see details.
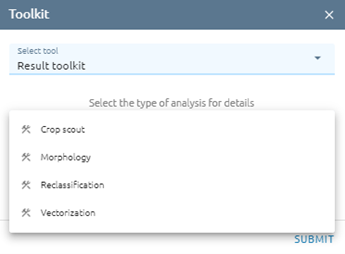
Result Toolkit
Includes the tools for analysing results.
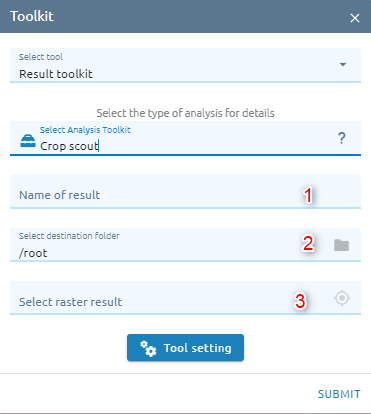
Crop Scout
Step 1: Type input
Type Name
Select destination folder to store result
Select raster which need to crop scout
Step 2: Click Tool setting button -> Select raster band (and select vector):
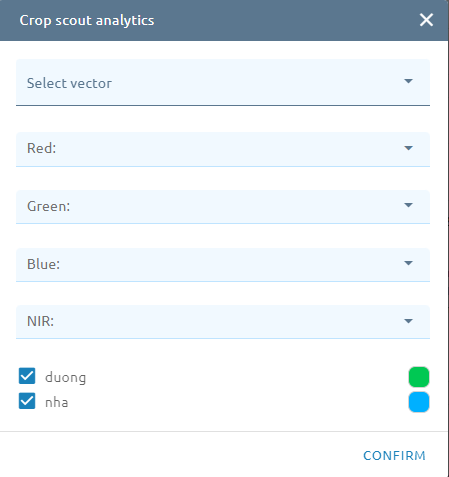
Step 3: Click Confirm button
The Task will be created in Tasks. Wait for task success, check result.
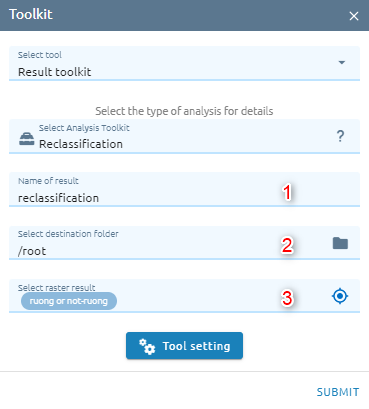
Reclassification
Reclassifies (or changes) the values in a raster.
Step 1: Type input
Type Name
Select destination folder to store result
Select raster which need to reclass
Step 2: Click “Tool setting” button
Click color box to change color for each class
Change name for each class
Change value for each class
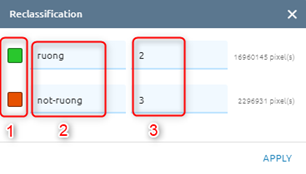
Step 3: Click Apply button. The Task will be created in Tasks. Wait for task success, check result.
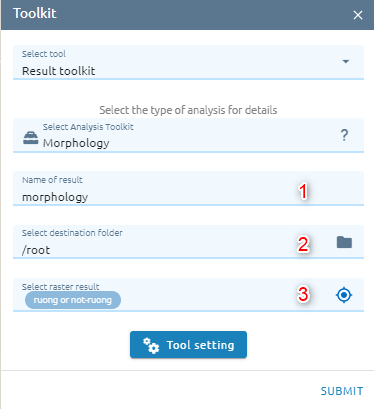
Morphology
This help users in post processing to eliminate the small area and fill the hole.
Step 1: Type input
Type Name
Select destination folder to store result
Select rater which need to morphology
Step 2: Click “Tool setting” button -> Type epsilon
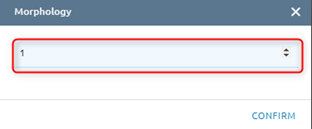
Step 3: Click Confirm button. The Task will be created in Tasks. Wait for task success, check result.
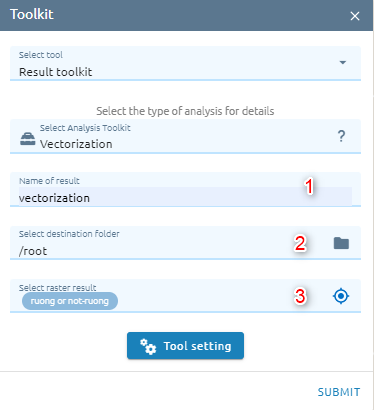
Vectorization
This help users convert raster to vector.
Step 1: Type input
Type Name
Select destination folder to store result
Select raster which need to vectorize
Step 2: Click “Tool setting” button -> Type epsilon
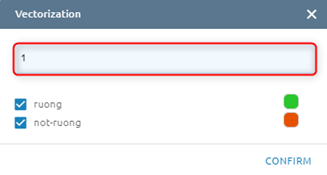
Step 3: Click Confirm button. The Task will be created in Tasks. Wait for task success, check result.
Unsupervised
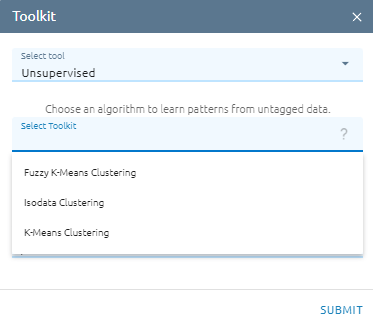
K-Means Clustering
K-Means Clustering is a method of vector quantization, originally from signal processing, that aims to partition n observations into k clusters in which each observation belongs to the cluster with the nearest mean (cluster centers or cluster centroid), serving as a prototype of the cluster. This results in a partitioning of the data space into Voronoi cells. k-means clustering minimizes within-cluster variances (squared Euclidean distances), but not regular Euclidean distances, which would be the more difficult Weber problem: the mean optimizes squared errors, whereas only the geometric median minimizes Euclidean distances.
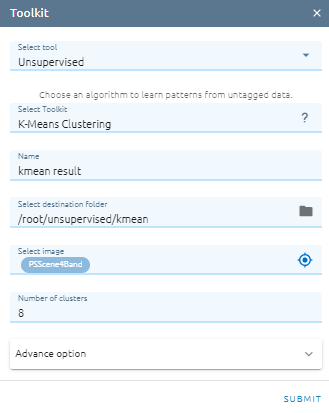
Type Name
Select destination folder to store result
Select input image
Type Number of clusters: The number of clusters to form as well as the number of centroids to generate.
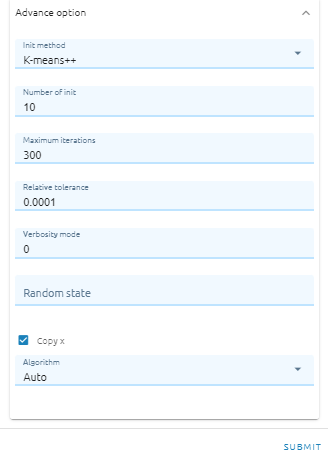
Select Init method: Method for initialization (K-means++ - selects initial cluster centers for k-mean clustering in a smart way to speed up convergence. See section Notes in k_init for more details.;**Random** - choose n_clusters observations (rows) at random from data for the initial centroids.)
Type Number of init: Number of time the k-means algorithm will be run with different centroid seeds. The final results will be the best output of n_init consecutive runs in terms of inertia.
Type Maximum iterations:Maximum number of iterations of the k-means algorithm for a single run.
Type Relative tolerance: Relative tolerance with regards to Frobenius norm of the difference in the cluster centers of two consecutive iterations to declare convergence.
Type Verbosity mode
Type Random state: Determines random number generation for centroid initialization. Use an int to make the randomness deterministic.
Checkbox Copy x: If Copy x is True (default), then the original data is not modified
Select Algorithm (Auto, Full, Elkan): The classical EM-style algorithm is “full”. The “elkan” variation is more efficient by using the triangle inequality, but currently doesn’t support sparse data. “auto” chooses “elkan” for dense data and “full” for sparse data.
Isodata Clustering
ISODATA unsupervised classification calculates class means evenly distributed in the data space then iteratively clusters the remaining pixels using minimum distance techniques. Each iteration recalculates means and reclassifies pixels with respect to the new means. Iterative class splitting, merging, and deleting is done based on input threshold parameters. All pixels are classified to the nearest class unless a standard deviation or distance threshold is specified, in which case some pixels may be unclassified if they do not meet the selected criteria. This process continues until the number of pixels in each class changes by less than the selected pixel change threshold or the maximum number of iterations is reached.
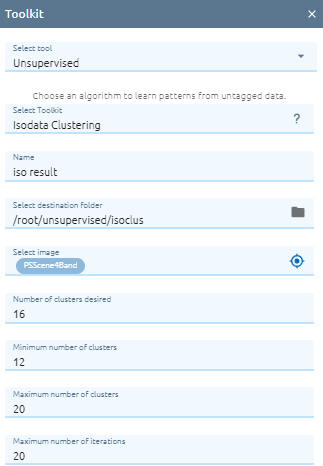
Type Name
Select destination folder to store result
Select image
Type Number of clusters desired: Specifies the number of clusters (classes) desired. Note that this is only an estimate; the final number of clusters may vary. You can, however, limit the variation by setting the maximum (MAXCLUS) and minimum (MINCLUS) cluster parameters.
Type Minimum number of clusters: Specifies the minimum number of clusters allowed. This parameter limits the total number of clusters allowed during lumping.
Type Maximum number of clusters: Specifies the maximum number of clusters allowed. This parameter limits the total number of clusters allowed during splitting.
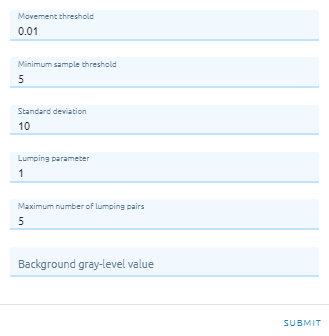
Type Maximum number of iterations: Specifies the maximum number of iterations for calculating the cluster mean positions.
Type Movement threshold: Specifies the movement threshold, in percentage of cluster means.
Type Minimum sample threshold: Specifies the minimum sample threshold. The number of samples in a cluster domain is compared to the value of this parameter.
Type Standard deviation: Specifies the standard deviation. If a cluster has a standard deviation greater than that specified in this parameter, splitting may occur. The default value of 10.0 is reasonable.
Type Lumping parameter: Specifies the lumping parameter. If the distance between two cluster centers is less than LUMP, the total number of clusters is greater than MINCLUS, and the number of lumped pairs is less than MAXPAIR, lumping of clusters will occur.
Type Maximum number of lumping pairs: Specifies the maximum number of pairs of cluster centers that can be lumped during each iteration.
Type Background gray-level value: Optionally specifies a background gray-level value to be ignored during classification. If this parameter is specified, pixels with the specified value will be assigned class 0 (null class).
Fuzzy K-Means Clustering
Fuzzy K-Means is a clustering method that allows each data point to belong to multiple clusters with varying degrees of membership.
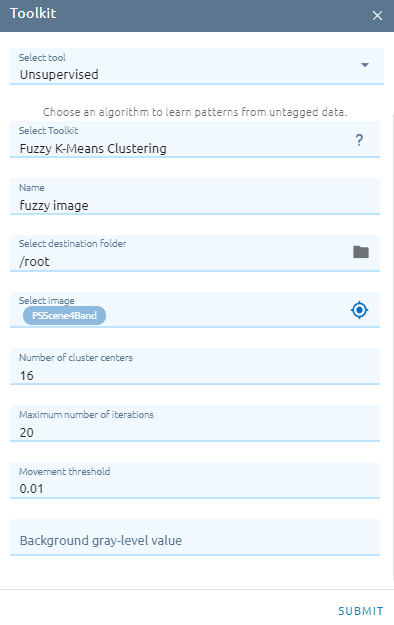
Type Name
Select destination folder to store result
Select image
Type Number of cluster centers: Specifies the number of clusters (classes) centers.
Type Maximum number of iterations: Specifies the maximum number of iterations for calculating the cluster mean positions.
Type Movement threshold: Specifies the movement threshold, in percentage of cluster means.
Type Background gray-level value: Optionally specifies a background gray-level value to be ignored during classification. If this parameter is specified, pixels with the specified value will be assigned class 0 (null class).
Table Toolkit
Click the link Table Toolkit to see details.
Identify
Allow to view attribute value for a feature or pixel value for each band of image.
Click Identify button:
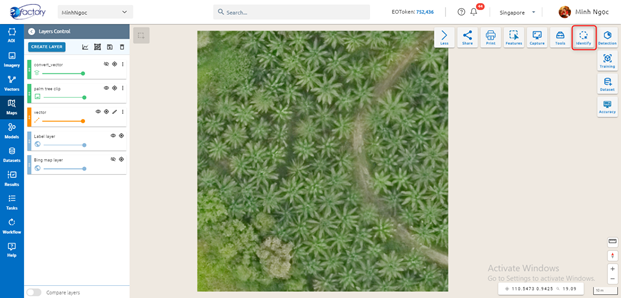
Click on a feature or point image to show value.
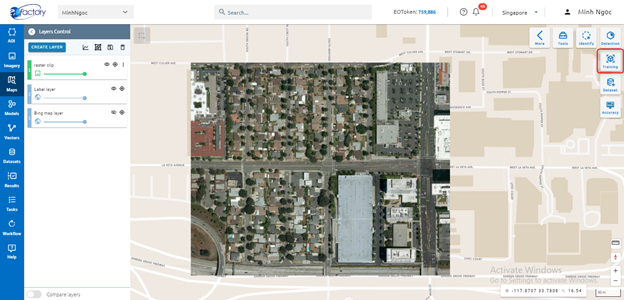
Training
Step 1: Click “Training” button in Maps
Step 2: Type input
Training model name
Select 1 of 4 types:
Classification (SK-CL-01)
Classification SK-CL-02-SAR)
Edge detection (SK-ED-01)
Object detection (SK-OD-01)
Multi Object Detection (SK-MD-01)
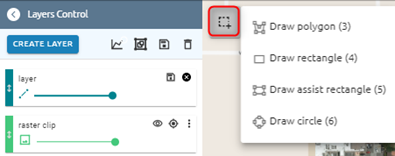
Each type will have the config to adjust the model with data. Changing the config click on
 icon
icon
Classification (SK-CL-01): There are 7 functions which can change: Epoch, Training size, N Filters, Batch normalization, Dropout, Optimizer, Loss Function, Metrics.
Epoch: a hyperparameter that defines the number times that the learning algorithm will work through the entire training dataset
Training size: the size of images which are cropped from the original images.
N Filters: is the number of kernel
Batch Normalization: this method normalize the features (the output of each layer after going through the activations) to a zero-means state with a standard deviation of 1
Dropout: A simple and powerful regularization technique
Optimizer: Optimizers are algorithms or methods used to change the attributes of your neural network such as weights and learning rate in order to reduce the losses.
Adam optimizer: An algorithm for first-order gradient-based optimization of stochastic objective functions, based on adaptive estimates of lower-order moments
Adadelta optimizer: is a more robust extension of Adagrad that adapts learning rates based on a moving window of gradient updates,instead of accumulating all past gradients
Stochastic gradient descent optimizer: An iterative method for optimizing an objective function with suitable smoothness properties
Adagrad optimizer: an optimizer with parameter-specific learning rates, which are adapted relative to how frequently a parameter gets updated during training
Loss Function: Neural networks are trained using stochastic gradient descent and require that you choose a loss function when designing and configuring your model.
Categorical cross-entropy: is used for single label categorization. This is when only one category is applicable for each data point. In other words, an example can belong to one class only.
Binary cross-entropy: is used on yes/no decisions, e.g., multi-label classification. The loss tells you how wrong your model’s predictions are. For instance, in multi-label problems, where an example can belong to multiple classes at the same time, the model tries to decide for each class whether the example belongs to that class or not.
Mean squared error: is the most commonly used loss function for regression. The loss is the mean overseen data of the squared differences between true and predicted values, or writing it as a formula.
Metrics: metric for evaluating classification models
Accuracy: is the fraction of predictions our model got right. the percentage of correct predictions in total number predictions
Binary Accuracy: can also be calculated in terms of positives and negatives. It calculates the percentage of predicted values that match with actual values for binary labels.
Categorical Accuracy: calculates the percentage of predicted values that match with actual values for one-hot labels.
Classification (SK-CL-02-SAR): There are 2 functions: Epoch and Training size are same above.
Edge detection (SK-ED-01): the config has only one option:Epoch
Object detection (SK-OD-01): There are 10 hyperparameter to change: Training size, RPN anchor scale, Epoch 1, Epoch 2, Epoch 3, Step per epoch, Validation steps, Max ground truth instances, ROI positive ratio, RPN NMS ratio
Training size: the size of images which are cropped from the original images.
RPN anchor scale: Length of square anchor side in pixels
Epoch 1, 2, 3: the number times that the learning algorithm will work through the entire training dataset
Step per epoch: Number of training steps per epoch. This doesn’t need to match the size of the training set. Tensorboard updates are saved at the end of each epoch, so setting this to a smaller number means getting more frequent TensorBoard updates. Validation stats are also calculated at each epoch end and they might take a while, so don’t set this too small to avoid spending a lot of time on validation stats.
8 Validation steps: Number of validation steps to run at the end of every training epoch. A bigger number improves accuracy of validation stats, but slows down the training. * Max ground truth instances: Maximum number of ground truth instances to use in one cut-image (with size equal training size) * ROI positive ratio: Percent of positive ROIs - Region of interest- used to train classifier/mask heads. * RPN NMS ratio: Non-max suppression threshold to filter RPN proposals.
Multi Object Detection (SK-MD-01): There are 11 hyperparameter: Epoch 1, Epoch 2, Anchor box scales, Anchor box ratio, RPN stride, Number RPN predict, RPN min overlap, RPN max overlap, Classifier min overlap, Classifier max overlap, Pooling regions.
Epoch 1, Epoch 2: a hyperparameter that defines the number times that the learning algorithm will work through the entire training dataset
Anchor box scales: the length of box’s side
Anchor box ratio: the ratio between length and width.
RPN stride: modifies the amount of movement’s anchor box over the image
Number RPN predict: number of boxes will be taken in each stride step.
RPN min overlap: is threshold to select the negatives
RPN max overlap:is threshold to select the positives.
Classifier min overlap:is threshold to select the negatives
Classifier max overlap: is threshold to select the positives.
Pooling regions: Region of interest pooling to convert the features inside any valid region of interest into a small feature map with a fixed spatial extent
Click Continue button
Select image: select image which you want to train
Type name into search input to search image -> Click image. Click location icon to add image to map.
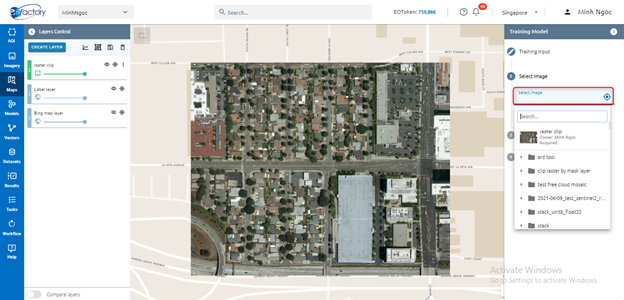
Click Continue button
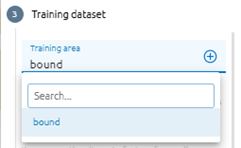
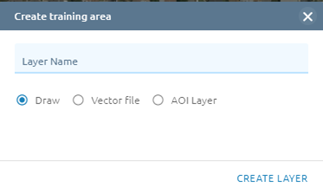
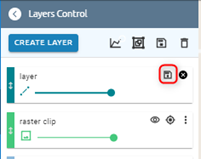
Training area layer: select exist layer or draw new one
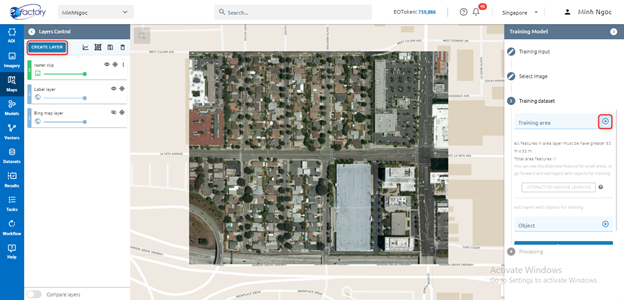
Step 3: Click Run button
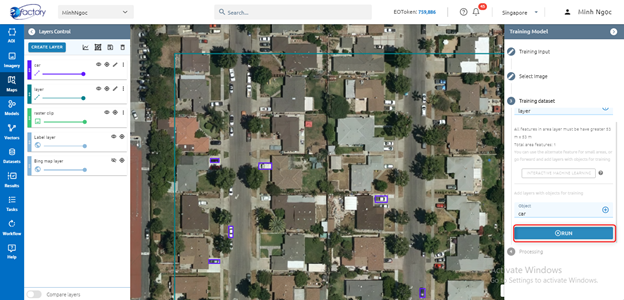
System creates tasks that train models. When the Task is successful, you will see your model in the Model Menu
Detection
Step 1: Click Detection button in Maps

Step 2: Select input
Select image you want to detect
Select model you want to use
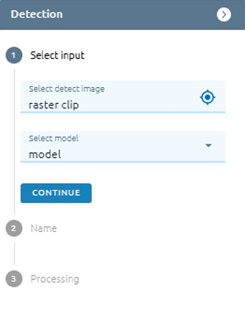
Step 3: Click Continue button
Step 4: Type name
Step 5: Click Run button
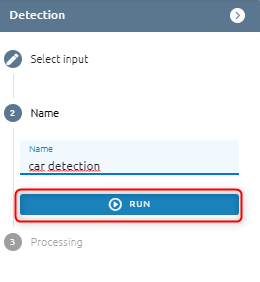
System creates tasks that detect objects. When a Task is successful, you will see your result in the Result Menu.
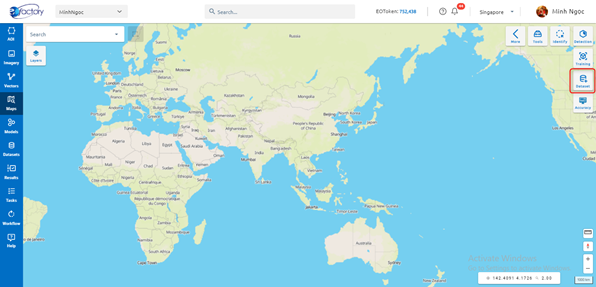
Dataset
Allow users to create training dataset.
For Object detection: only select an annotation. As for Classification detection: select many annotations.
Step 1: Click Dataset button
Step 2: Type input
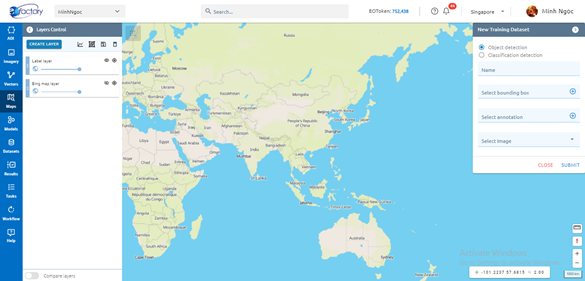
Step 3: Click Submit button
Accuracy
Allow users to check accuracy of model
Step 1: Click Accuracy button
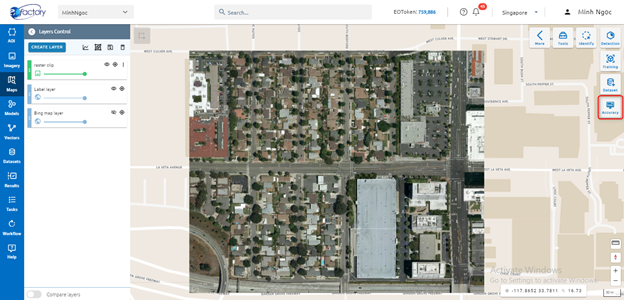
Step 2: Type accurate report input
Type report name
Select model
Select image
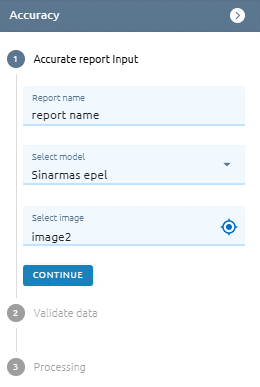
Step 3: Click Continue button
Step 4: Validate data: Select exist layer or create new one
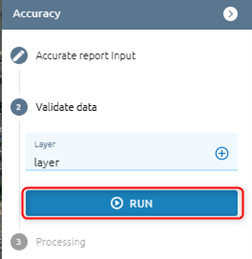
Step 5: Click Run button
After clicking, a task will be created. When a task is successful, check the result in the menu Model. * Step 6: Check result in Models: Model detail of selected model -> Tab Accurate Report